Each case below is a screenshot taken directly from the client's own Search Console or Analytics property. Every number is shown with the window it was measured over and the baseline it is compared against. Search performance depends on market, competition, authority and how much of the plan actually gets implemented, so none of this is a prediction of what another business would see.
Case 01 · Search visibility
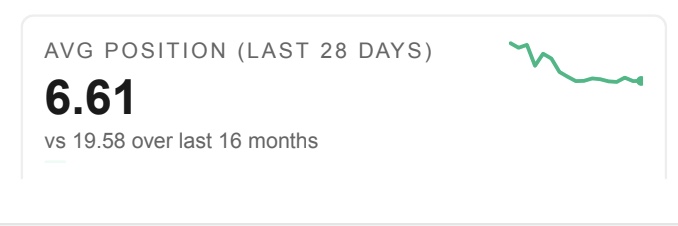
Average position moved from 19.58 to 6.61 as the site was restructured
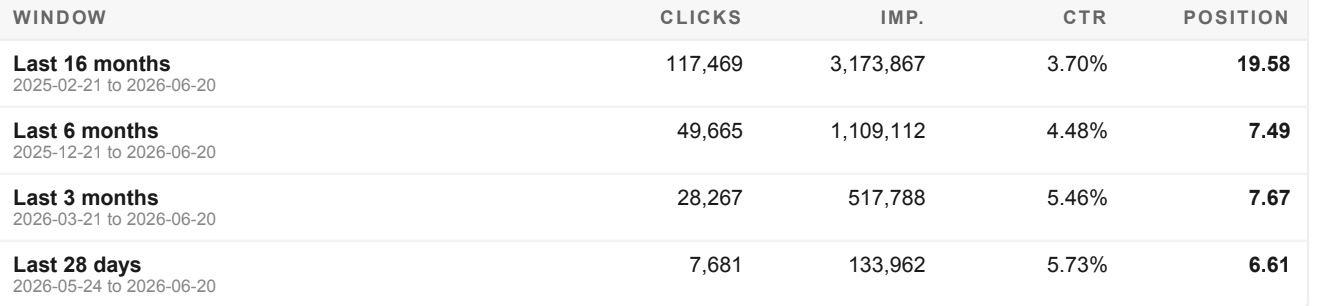
Comparing the trailing 16-month baseline (2025-02-21 to 2026-06-20) with the most recent 28 days, average position improved 19.58 → 6.61 and click-through rate 3.70% → 5.73%. Clicks over the full 16 months: 117,469 from 3,173,867 impressions.
[Client context to be added: business category, what was rebuilt, and what caused the inflection point.]
Search Console, Average Position — last 28 days vs 16-month baseline.Search Console, one client account. Shorter, more recent windows show stronger position and CTR than the 16-month baseline.
Case 02 · Organic growth
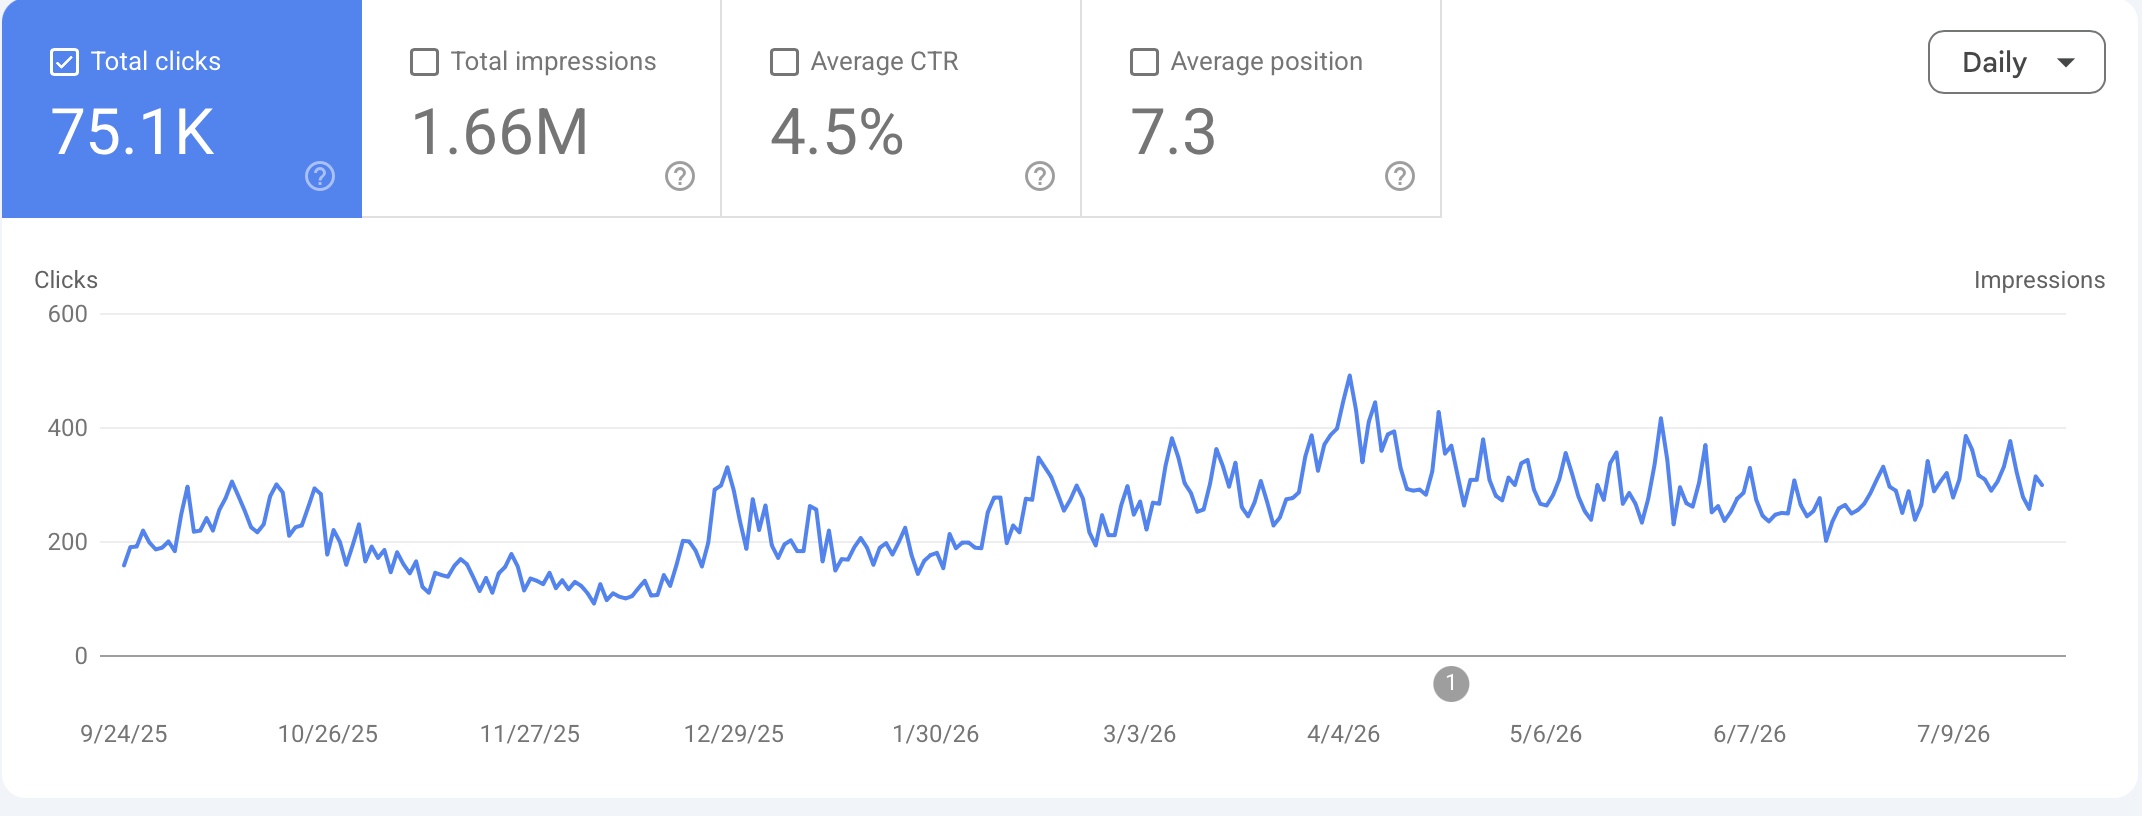
75,100 organic clicks over roughly ten months
Search Console 2025-09-24 to 2026-07-09 — 75,100 clicks, 1.66M impressions, 4.5% average CTR, 7.3 average position. Daily clicks sit visibly higher across the second half of the range.
[Client context to be added: business category, what was rebuilt, and what caused the inflection point.]
Search Console daily clicks, 2025-09-24 to 2026-07-09.
Case 03 · Audience growth
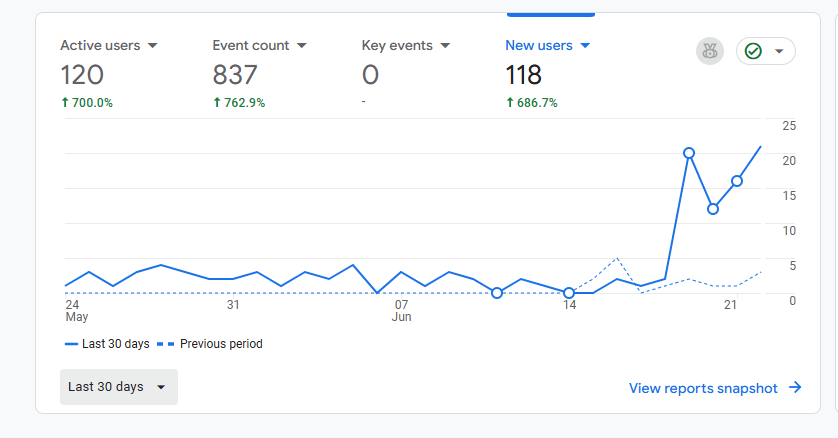
Analytics traffic step-change after launch
Analytics for a 30-day window against the previous period — 120 active users, 118 new users, 837 events. The step up is concentrated in the final stretch of the window rather than spread evenly.
[Client context to be added: business category, what was rebuilt, and what caused the inflection point.]
Analytics, last 30 days versus previous period.
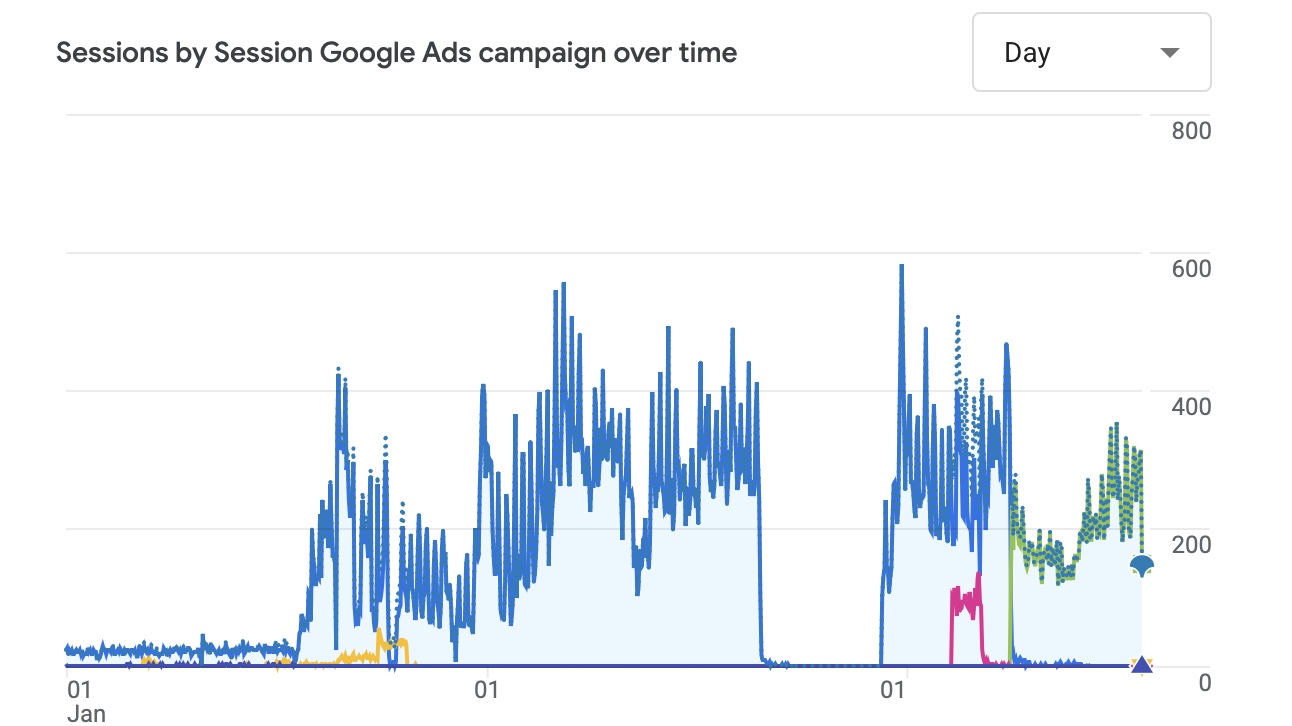
Case 04 · Session patterns
Reading seasonality before deciding what to build
Daily sessions across more than two years for a seasonal service business. Long flat stretches between sharp in-season peaks — worth understanding before deciding which pages deserve to exist and when they need to be live.
[Client context to be added: business category, what was rebuilt, and what caused the inflection point.]
Analytics sessions by day, multi-year window for a seasonal service business.